

THE ECONOMICS OF SHIPPING AI — #2 · Measure first, then decide.
A follow-up to the 18¢ piece. That one measured the cost bar. This one measures the latency bar. The goal — precision — never moves.
I was at a dinner for AI leaders at a large bank this week. I asked one of the engineering VPs the question I always ask: what is actually in the way? Not the roadmap — what stops the thing from shipping.
She answered immediately, without having to think about it. Cost against latency.
I asked what models they run. She declined, which is the right answer to that question from someone she met an hour earlier, and I did not press. But the constraint itself she stated plainly, as the thing her organisation is up against.
That stayed with me, because it is not the argument I made in the 18¢ piece. That one was about where the money goes and had nothing to say about time. I had a gap between what I had published and what someone actually running one of these platforms told me was hard.
So I measured it. Not next quarter — the next day, on the only system where I control every variable.
What I am actually measuring
There is an AI concierge on thewhyman.com. A recruiter or hiring manager lands on the page and asks it questions about me — how large a team have you run, what is your reliability record, where has your judgment failed — and it answers from a knowledge base I maintain.
It is a small system with a serious job, and that combination is why it is a useful proxy:
Wrong is expensive. If it drops a number or invents one, that is my credibility with someone deciding whether to interview me. There is no "eh, close enough."
Slow is visible. Nobody waits ten seconds on a personal site. They leave, and I never learn they were there.
The answers are numbers-heavy — team sizes, portfolio scale, availability figures — which makes precision measurable instead of a matter of taste.
The stack, so you can map it onto yours:
Serving — Cloudflare Workers AI, streaming responses at the edge.
Shape — retrieval into a prompt. The same shape as most enterprise RAG.
Knowledge base — about 15,000 tokens total, of which a typical answer needs a fraction.
Retrieval — deterministic keyword selection over labelled blocks, not vector search, so I can tell exactly what the model saw for any given answer.
Volume — low. One site. ⚠️ Nothing here is a scale claim.
⭐ What transfers is not my numbers — it is the method, and the size of the error I found by re-running it. A bank at volume has different absolutes and the same structure: retrieval into a prompt, a quality bar that cannot move, a cost line somebody reviews monthly, and a latency budget a human is sitting inside.
Six models, same knowledge base, same question, five runs each.
It was never a triangle
Cost, latency and precision get drawn as a triangle. Three things in tension, pick two. That framing is in most vendor decks and it is wrong in a way that costs you the decision.
They are not three of a kind. Precision is the goal. Cost and latency are bars.
A bar is a threshold. You clear it or you do not, and clearing it by more buys you nothing — nobody thanks you for 200ms when the SLA was two seconds. Precision does not work that way. It is the thing you are maximising, and there is no point at which more of it stops being worth having.
Everything else is a dial.
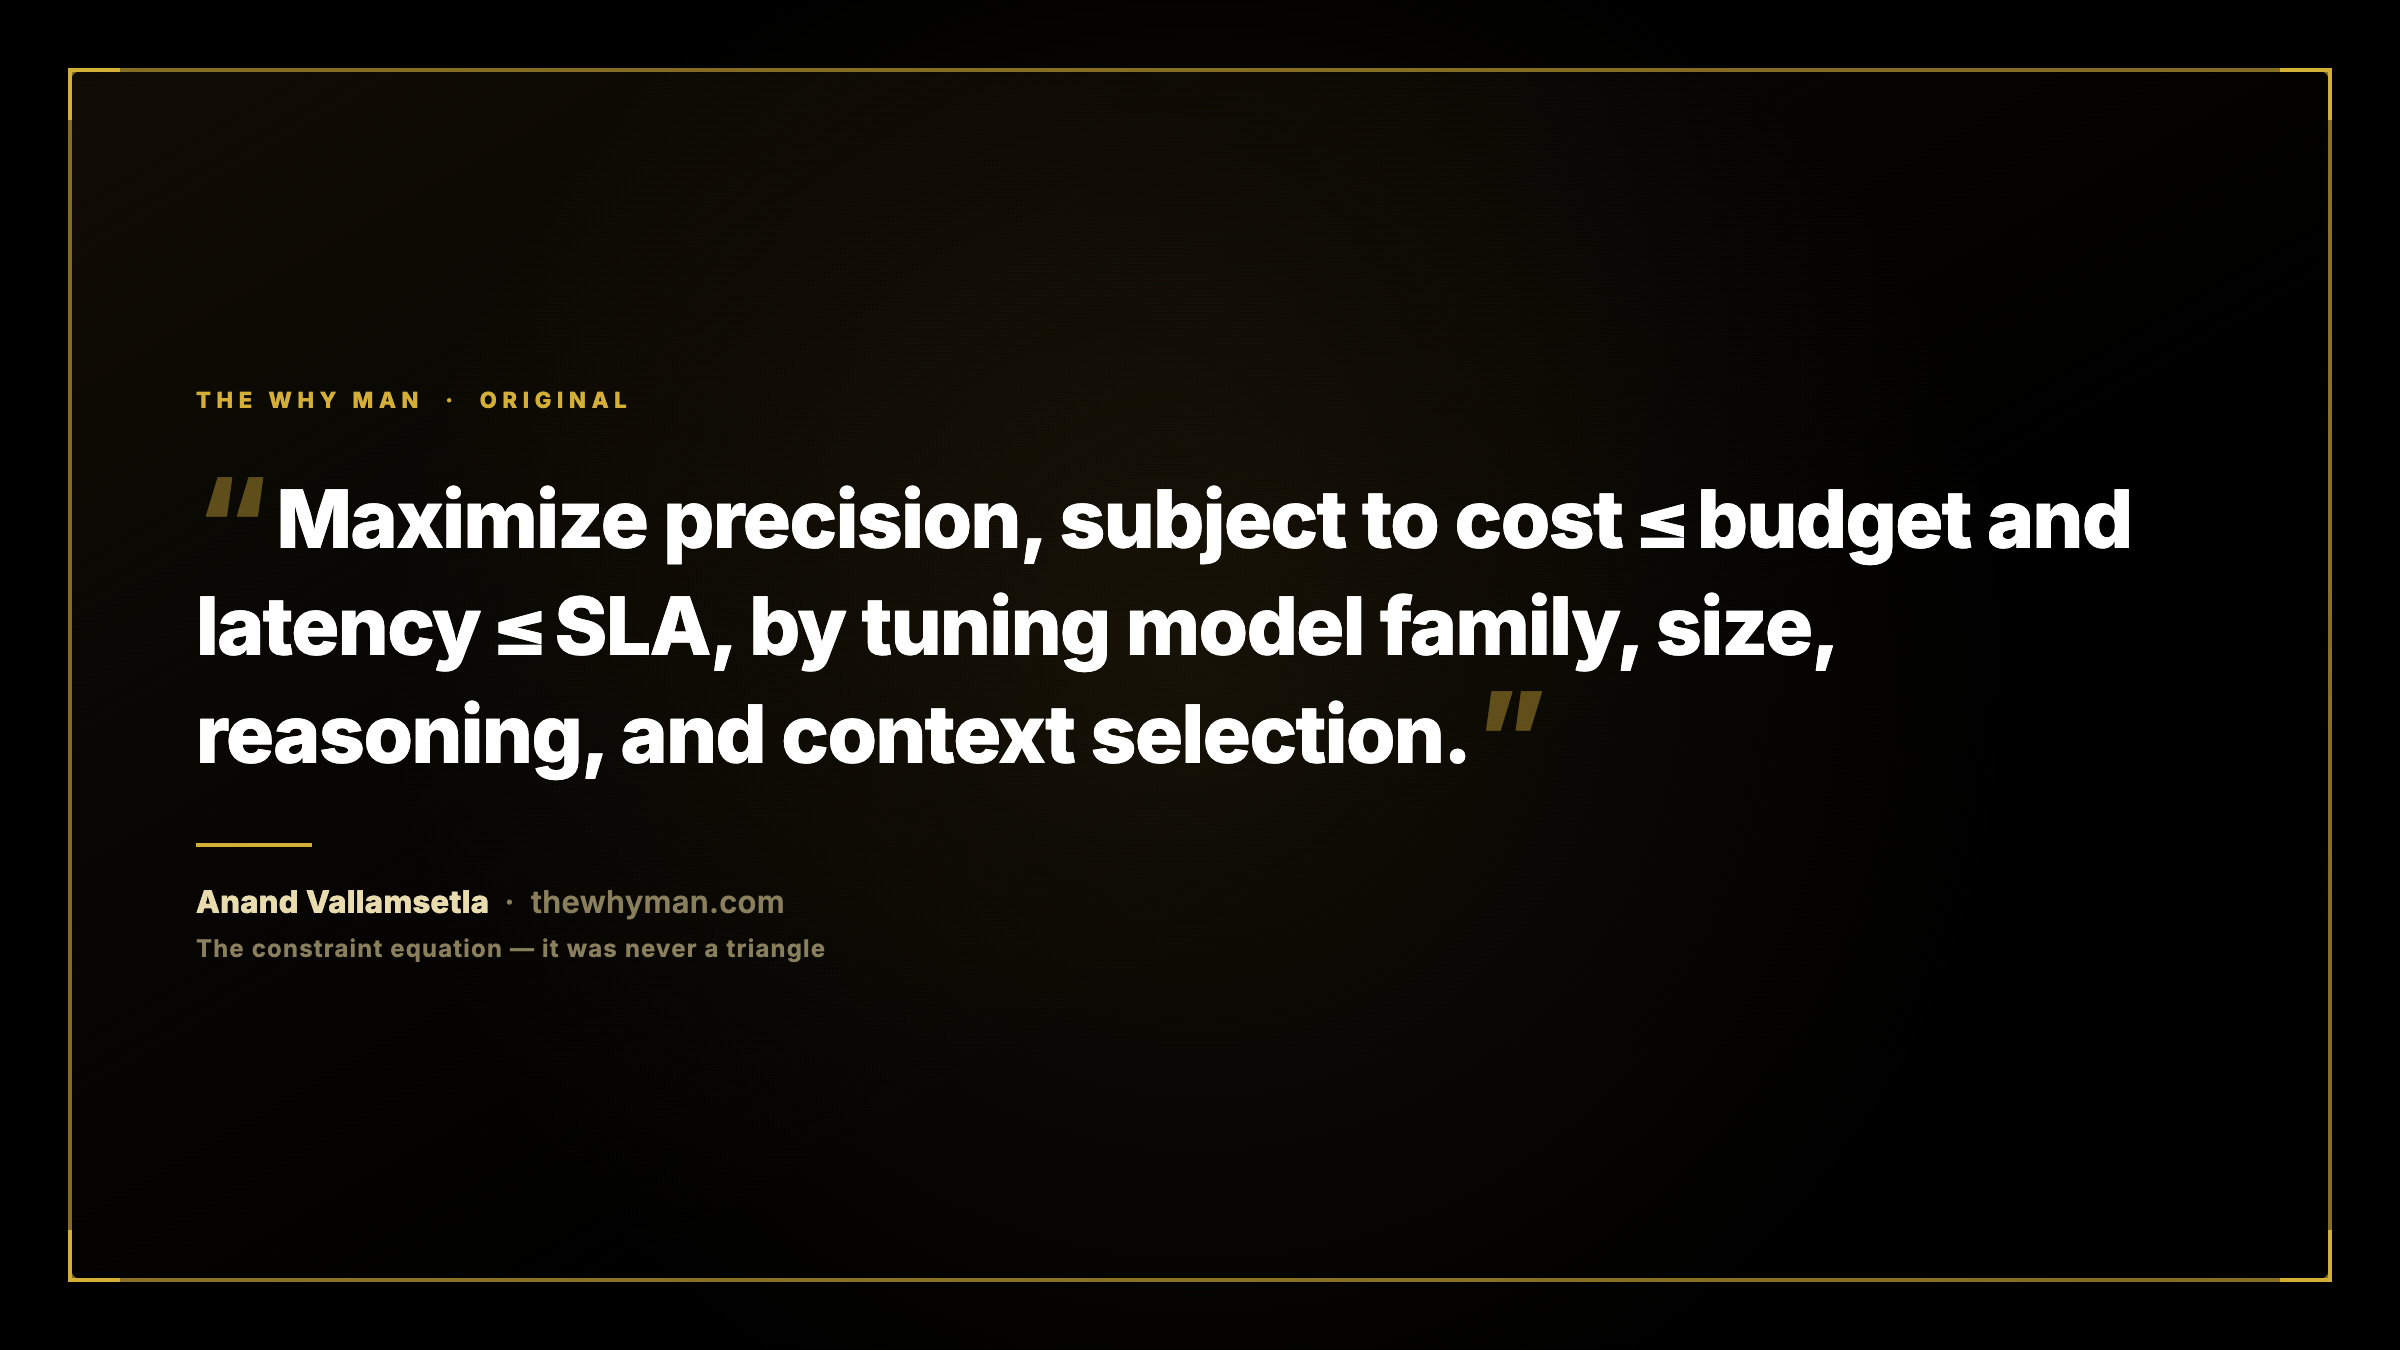
That line replaces the triangle, and it tells you what to do when a model disappoints you. In the results below there is a model that cleared both bars comfortably and still lost, and a model that hit the goal and blew a bar. Neither is a tradeoff. One violated a constraint. The other missed the point. You fix those differently, and a triangle cannot tell you which you are looking at.
What the numbers said
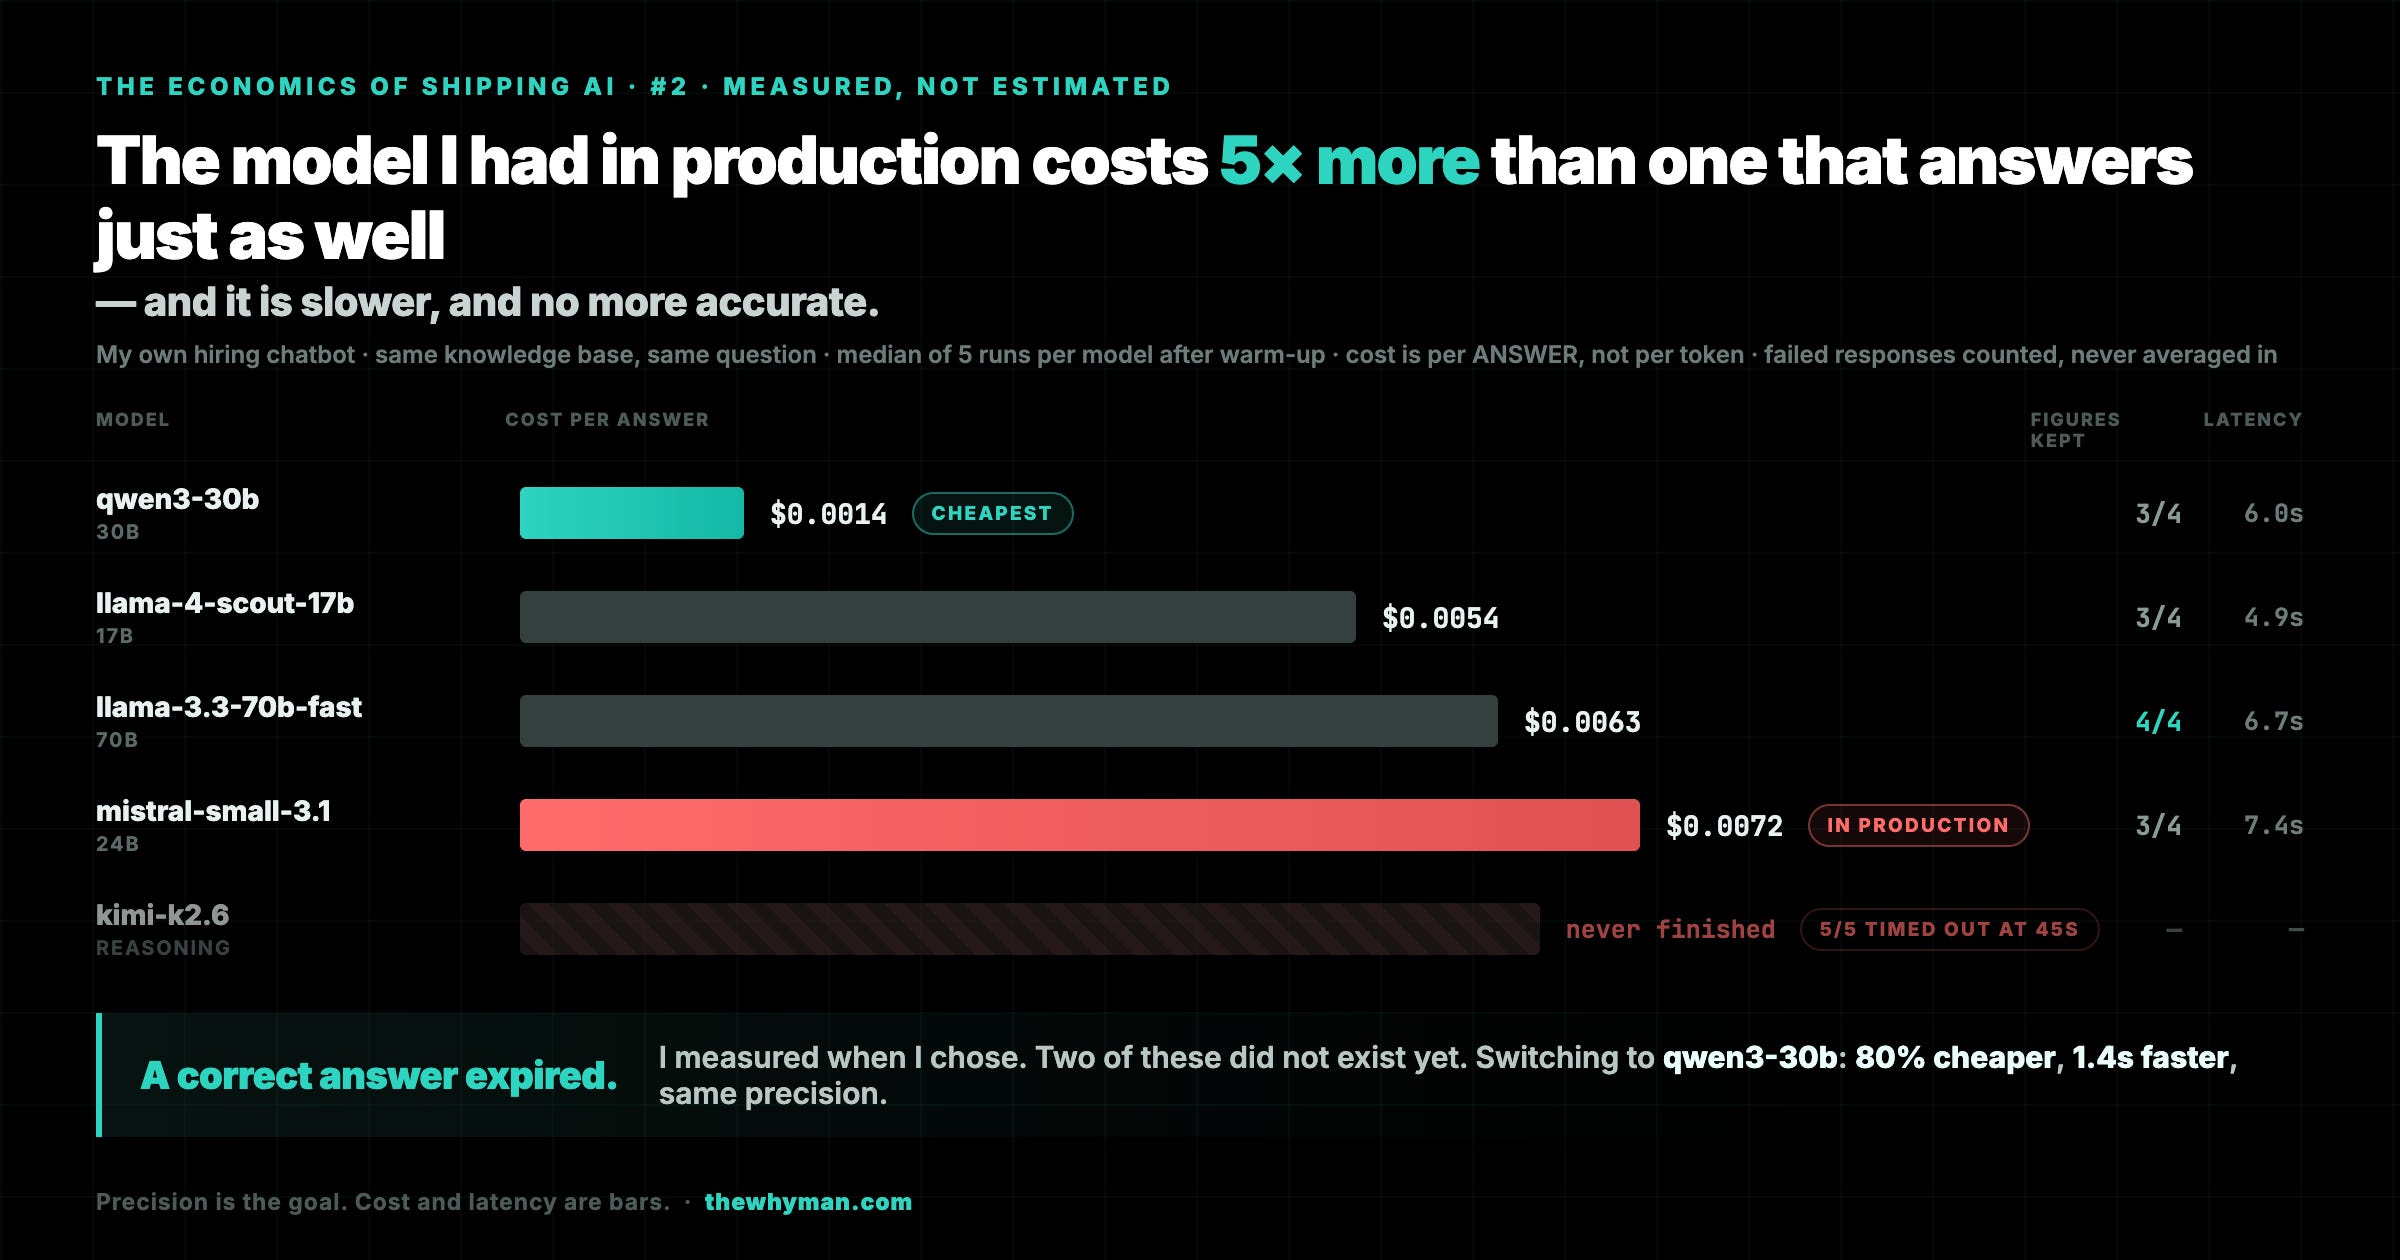
Median of five runs per model, after a warm-up call I throw away. Failed responses counted separately, never averaged in.
⭐⭐ The model I had in production was the worst of the four that worked, on all three axes. Most expensive. Slowest. No more accurate. Something in that table is 80% cheaper, 1.4 seconds faster, and drops exactly as many figures.
Nothing about that is a tradeoff. It is an unmeasured default, which is a different and more embarrassing thing.
And the reasoning model did not lose on latency — it never finished. Five of five runs failed against a forty-five-second ceiling. For this workload it cannot clear the bar at any price. It was buying deliberation on a task with almost nothing to deliberate about: pull the right figures out of supplied context and say them plainly.
Three method notes, because each exists where the naive version lied to me:
Throw away the first call. A cold start recorded 137 seconds and made one model look like the cheapest winner at two samples. It was failing two runs in three.
Medians, not means. Cost varied 0.7% across five runs; precision swung between 3/4 and 4/4 with nothing changed. Cost is stable enough to publish from few samples. Accuracy is not.
Count failures separately. A request returning nothing in four tenths of a second is the fastest number in the set. Worse, I was still billed for it. Failure is not the absence of cost. It is cost with no product.
📌 Which points at the thing underneath: I did not benchmark six models. I benchmarked one platform's serving of six models, on one afternoon. That is the honest reason to run your own numbers — public benchmarks answer a different question than the one you have.
The drift nobody named
Here is the part I did not expect, and the one I would put in front of an executive.
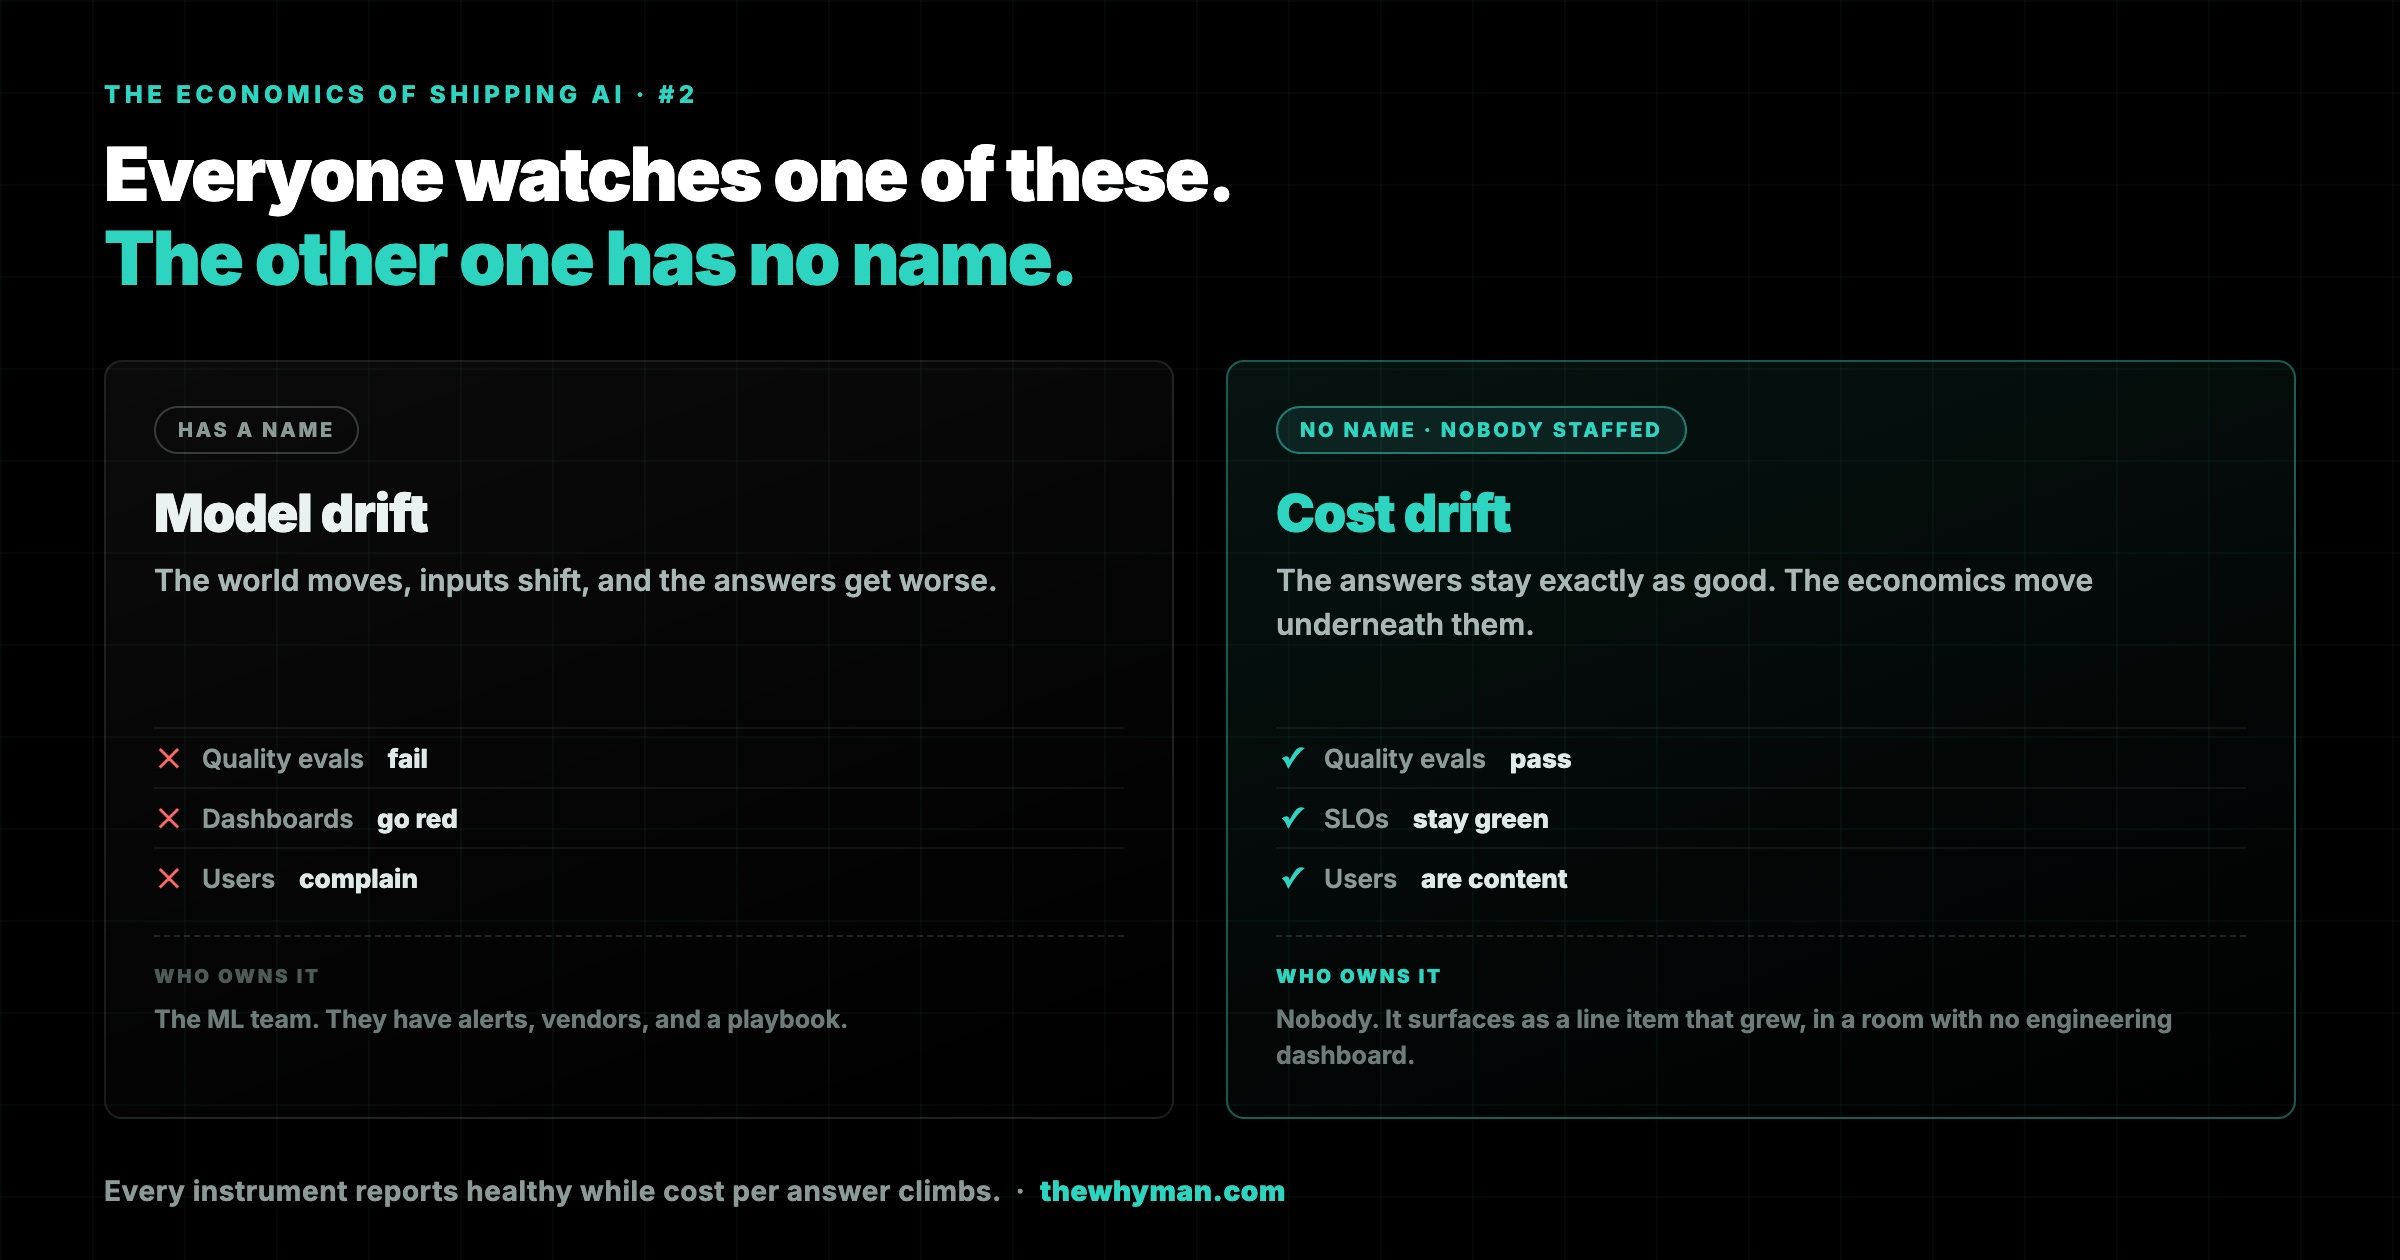
Model drift is named, watched and tooled. Everyone knows the shape: the world moves, inputs shift, answers get worse. There are dashboards, alerts, vendors.
Look at what that does to your safeguards. Quality evals pass — output unchanged. SLOs green — nothing got slower. Users content — they cannot tell. Every instrument reports healthy while your cost per unit of work climbs for a quarter.
⭐ And notice who owns each. Model drift is an engineering alarm with a team that knows what to do. Cost drift arrives as a line item that grew without explanation, in a room where nobody has an engineering dashboard. The more senior problem, with the less mature tooling.
I want to be precise about my own case, because the obvious version of this story is not what happened. I did measure when I chose the model. I ran the comparison, picked the winner on evidence, shipped it. The embarrassing part is not that I skipped the work — it is that the answer expired and I did not notice. Two of the models that beat it this week did not exist when I chose.
That is a new failure mode, not dependency drift renamed. In conventional software your dependency graph changes only when you change it, and pinning is a complete defence. Here it is not — because pinning protects correctness, and what decayed was optimality. My pinned model kept working: same accuracy, no errors, nothing in any log. It quietly became the most expensive way to get that result, because correct is absolute and best is relative to a menu somebody else controls.
There is no lockfile for that. No test fails.
Continuous Evaluation
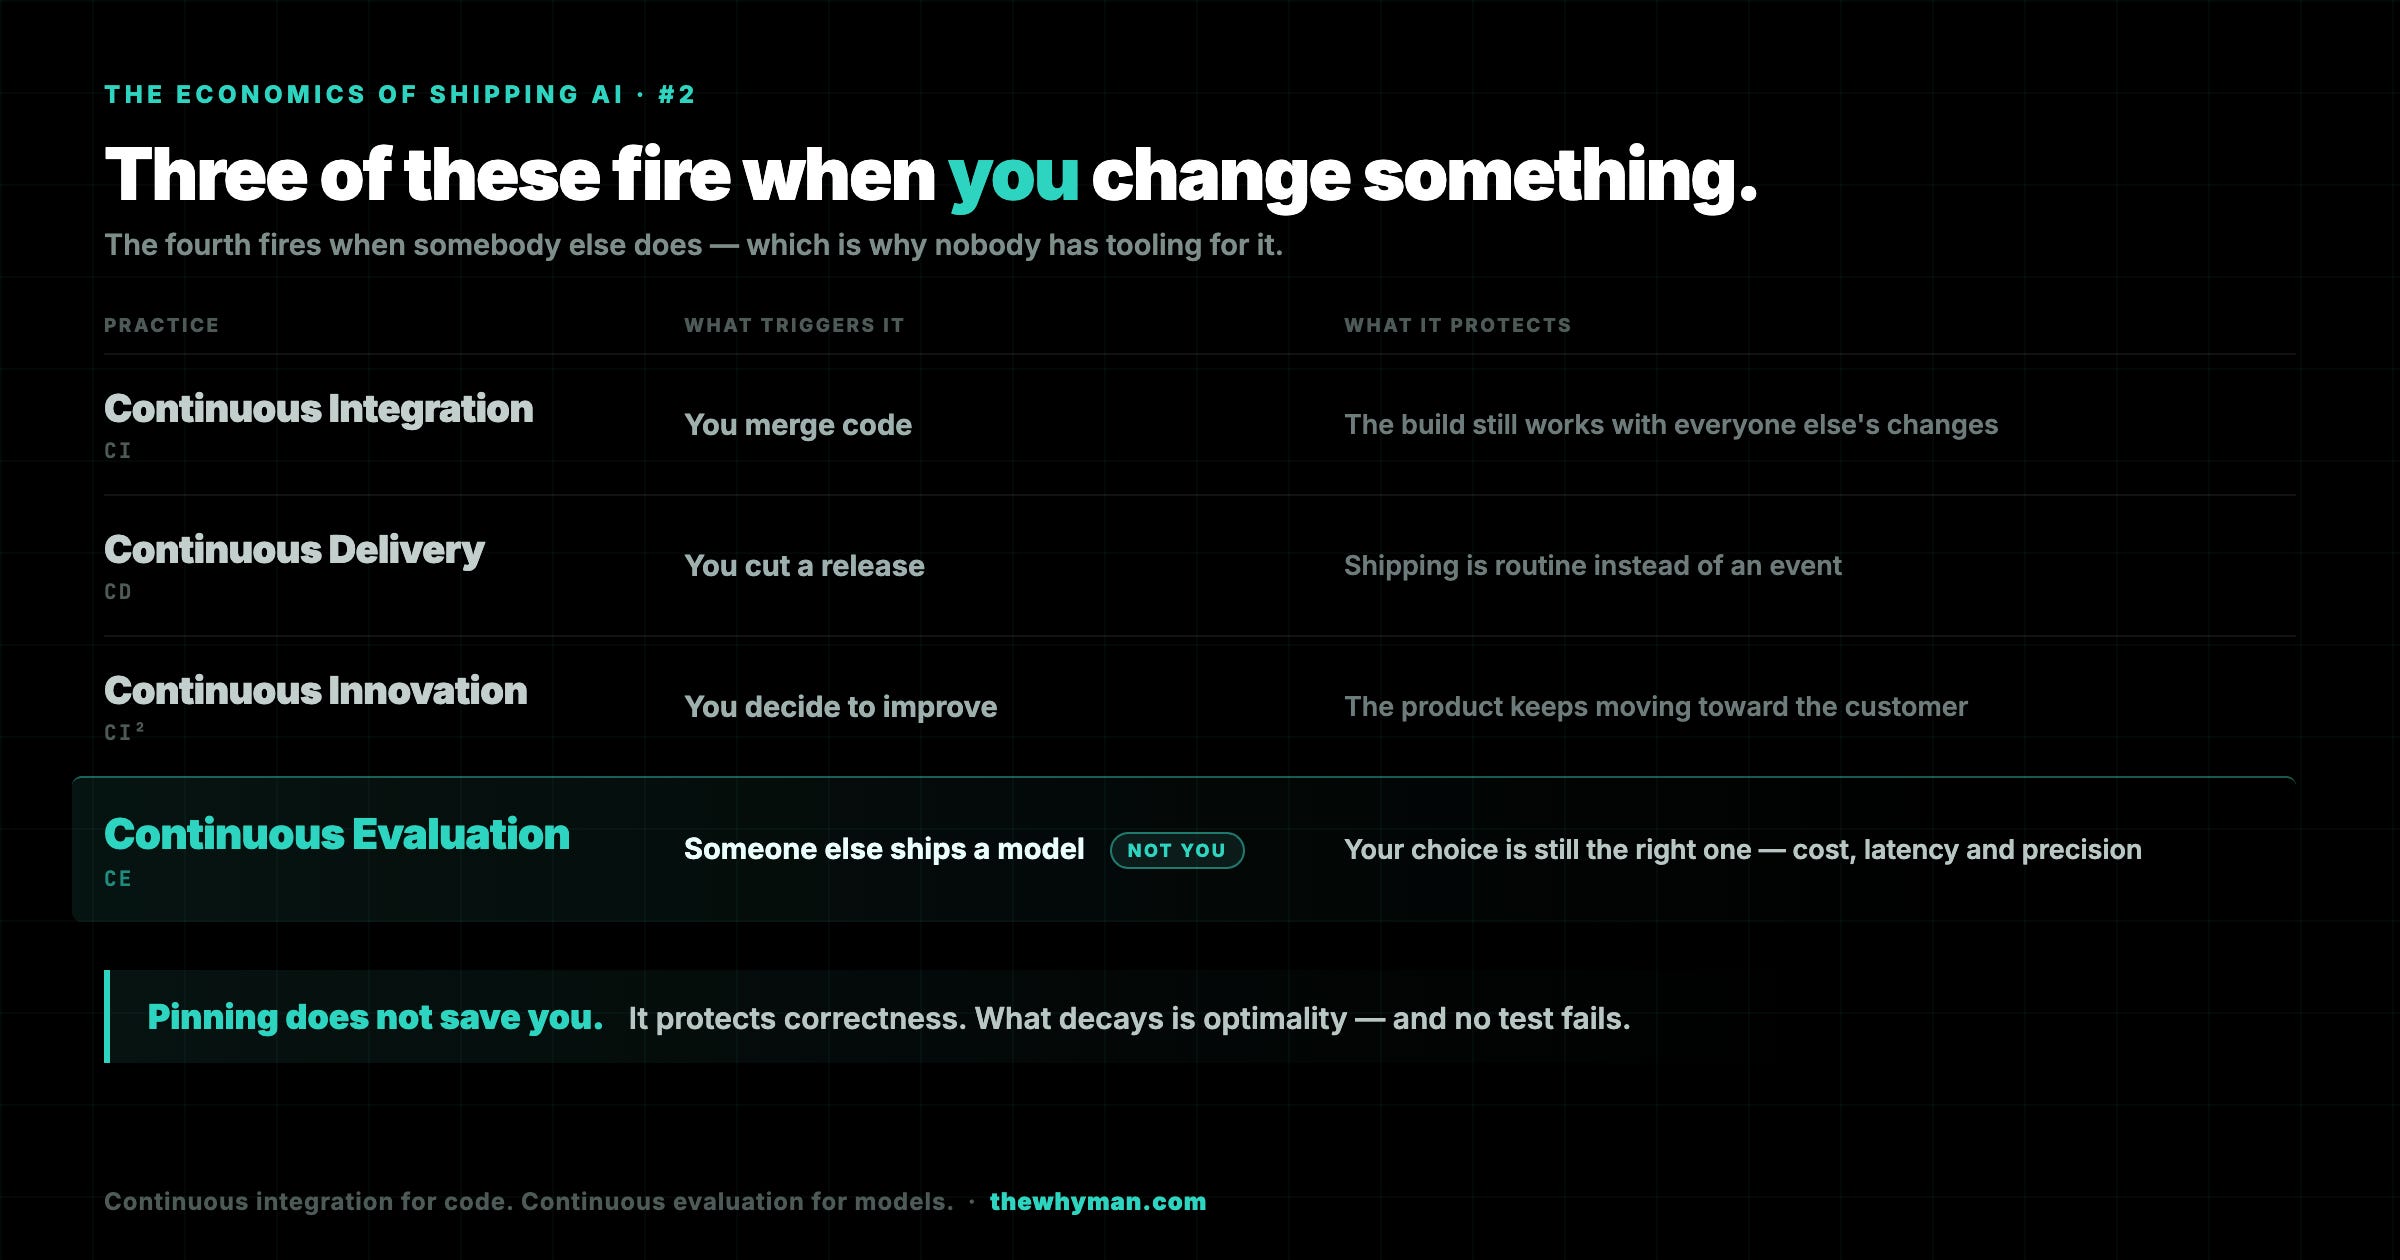
Years ago I gave a talk at SXSW about continuous integration, delivery and innovation — that shipping is not an event you schedule but a capability you maintain. This is the same argument wearing different clothes.
So a one-time bake-off is the wrong shape. It answers which model is best today, and the honest shelf life on that is somewhere between a quarter and a month.
⭐⭐ If you already run continuous evals — and most serious teams do — this is not new infrastructure. Your suite runs on a schedule and gates releases. It almost certainly measures quality alone. Put cost and latency in the harness you already own. Same fixtures, same schedule, same gate. Three columns instead of one.
That small change makes two things visible that were structurally invisible:
Regressions you ship blind. A prompt change that adds context is a cost increase, and nothing in a quality-only suite flags it. Mine moved 2.5× on identical infrastructure purely from how much context the router loaded.
Savings nobody is hunting. An 80% reduction does not announce itself. It shows up as a new row in a table you were already generating.
📌 And it inverts the objection. The reflex is that evaluation is overhead. The harness I built to answer a latency complaint is the same harness that found an 80% cost reduction on a system I had already optimised. Evaluation is not the tax you pay for shipping AI. It is the instrument that finds the money.
What I would tell a platform team
Precision is the goal; cost and latency are bars. When a model disappoints, first ask which one it failed — you fix those differently.
Price per completed answer, not per million tokens. Nobody consumes a million tokens, and a failed request still bills.
Put a correctness metric in the comparison. "Figures kept" was invented for this problem and it is the only thing that stopped me shipping a model that answers fast and leaves the numbers out.
Warm up, take medians, count failures separately. All three exist because the version without them handed me a confident wrong answer.
⭐ Keep the harness and re-run it. Continuous integration for code, continuous evaluation for models — because the right answer moves without asking your permission.
The 18¢ piece found the cost bar breached by rework, because verification was missing. This one finds the latency bar breached by capability the task never asked for. Same goal, different bar — and neither is safely reclaimed without the same instrument underneath.
One site, one workload, five runs per model. If you have measured this at real scale and got something different, I want to hear it.